With the current trend in the plastics production industry, namely, in the evolution towards Industry 4.0, centralized information and control of all stages in the production of components are essential. At the level of production carried out by the injection moulding process, this monitoring includes, among others, its processing.
Currently, injection equipment is already equipped with monitoring technologies to improve process control and efficiency. However, these only apply to variables controlled on the machine (spindle temperatures, spindle rotation speed, dosage, injection speed, back pressure, compaction pressure, compaction time, pad, etc.). Thus, there is still a lack of control in the moulding cavity, where the behaviour of the molten polymer (viscous dissipation, heat transfer, etc.) can influence other process variables, as well as the quality of the final product.
To compensate for this lack of control, sensors are currently installed, mostly for pressure and temperature, in the cavity. Connected to a data acquisition system, these sensors make it possible to obtain variation curves that, related to theoretical curves, allow the identification and control of causes in the variation of the process and in the quality of the component produced. [1].
When this control is performed in real-time, with the automatic adaptation of the process conditions, automation, greater efficiency, predictive maintenance of equipment, and cost reduction are possible. Thus, within the scope of the FITEC Interface Program – Innovation Fund, Technology Transfer and Circular Economy, PIEP acquired knowledge in monitoring the pressure and temperature of polymeric materials in the mould cavity, through a data acquisition system, from Kistler.
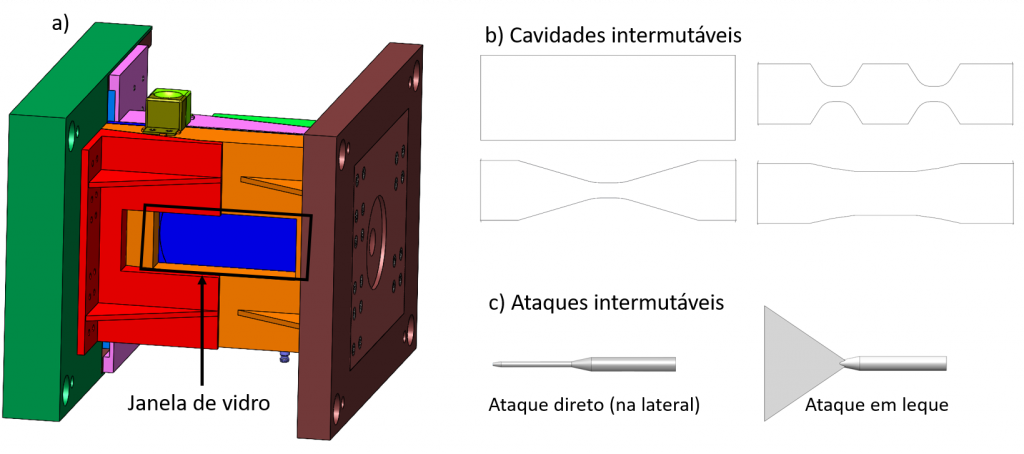
In this sense, a set of experiments was carried out to correlate the monitoring of the cavity, in the injection moulding process, using a high-speed camera. A mould with a glass window was used (Figure 1 a)), which allows visualization of the flow advance. This mould includes different moulding cavities (Figure 1b)) and interchangeable injection moulds (Figure 1c)), which allow the analysis of their influence on the behaviour of the material during filling, compaction, and cooling. It is thus possible to visualize the filling profile and associated defects (e.g. the jet effect), the identification of the material’s contraction during its cooling, of defects associated with the filling in the integration of decorative and/or functional films (washout), cell growth in materials with expanding filler integration, etc. In Figure 2 there are two different filling profiles, influenced by the alteration of the injection system (attacks represented in Figure 1).

Figure 1 – a) – Mould with glass window; b) interchangeable cavities; c) interchangeable power attacks.

Figure 2 – Filling profile for the different interchangeable attacks.
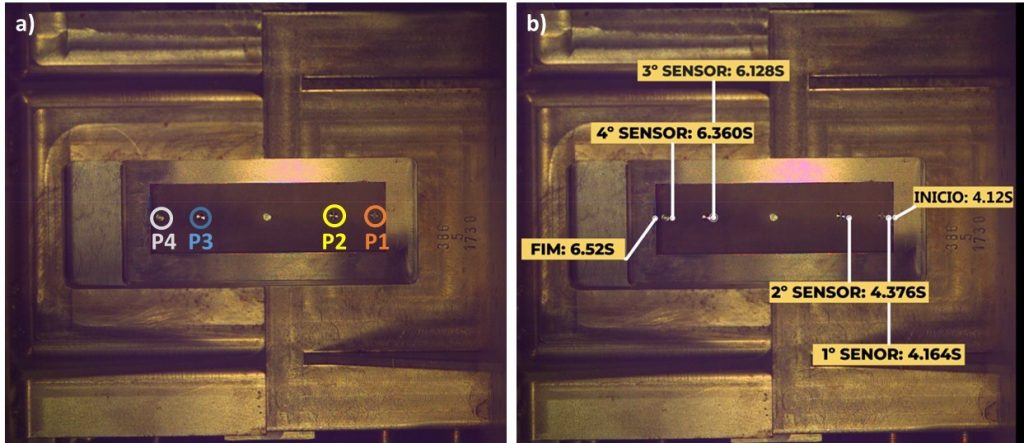
In this sense, the pressure in the cavity was monitored, through the assembly of sensors whose location is identified in Figure 3a). Using a high-speed camera, the filling of the cavity was recorded and the time of the passage of the flow front in each sensor was identified, represented in Figure 2b).

Figure 3 – a) Location of pressure sensors; b) Identification of the time of the flow front passage in each sensor, through the analysis of the filling profile recorded by the high-speed camera.
The data obtained by the data acquisition system were later analyzed, in order to also identify the beginning of the sensor’s measurement, which corresponds to the passage of the melt front in them. In the obtained graph, represented in Figure 4, the times of the beginning of the pressure measurement for each sensor are identified, with a circle, as well as the corresponding value. The time difference between these values and those obtained when recording the flow advance using a high-speed camera was thus calculated, described in the table in Figure 4. It is thus possible to verify that the time difference is not significant, proving that the process monitoring accurately represents the pressure variation in the cavity during the injection moulding process.
Figure 4 – Graph of pressure variation (bar) in the cavity over time (s).
Agradecimentos
Work carried out within the scope of the FITEC Interface Program – Fund for Innovation, Technology Transfer, and Circular Economy.

Authors:


Cátia Araújo, Research Engineer of the Advanced Manufacturing Processes – Polymers area of PIEP;
Diogo Pereira, Research Engineer of the Advanced Manufacturing Processes – Polymers area of PIEP;
Sílvia Cruz, Coordinator of the Advanced Manufacturing Processes – Polymers area of PIEP.
Article originally published in InterPLAST Magazine.
Know more about the Advanced Manufacturing Processes – Polymers area of PIEP.


